The Spectrum & Chromaticity System (Pro), hereinafter referred to as “SCS Pro”, designed by Yujileds scientists, is a comprehensive and full-functional tool compared to the simple online version as on this page. It is built in Microsoft Excel for universality that users do not need to install extra software but can provide many rich functions. It is free and open-source and we welcome global experts in any relevant industry to join us to upgrade or correct the data inside. Yujileds® reserves all of the rights to decide or allow to share or not with any individual or organization/company.
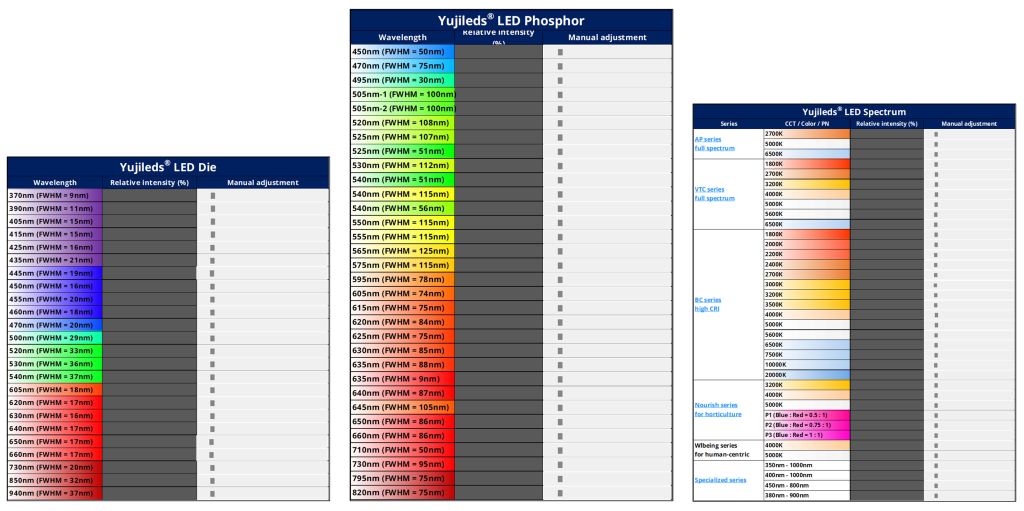
The spectrum design is a core function of the SCS Pro. It contains, almost, all of the feasible wavelengths of LED die and phosphor in the worldwide commercial markets, including the Yujileds® high-performance LED spectra. And it allows the user to define and input three spectra to mix or calculate individually in this system.
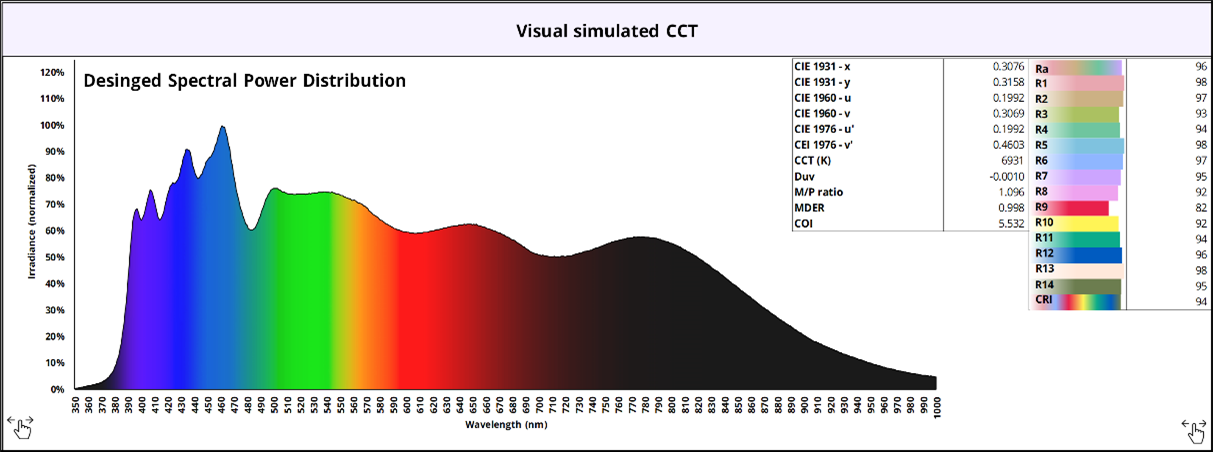
– Visual simulated color, combined spectrum and colorimetric calculation.
The SCS Pro would calculate relevant data according to the designed spectrum, including but not limited to CIE 1931/1960/1976 chromaticity coordinates, correlated color temperature, DUV, M/P ratio and CRI values. The simulated CCT/color helps to feel the visual perception of the designed spectrum.
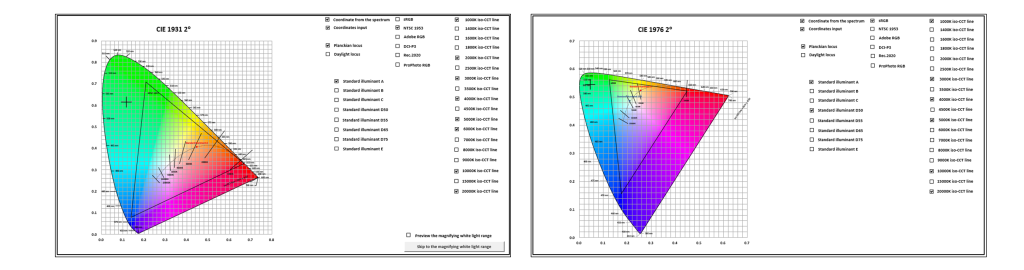
– CIE diagram and chromaticity coordinates presentation.
The system allows users to input 5000 chromaticity coordinates to present in the CIE 1931/1976 diagrams, color gamuts of sRGB, NTSC1953, Adobe RGB, DCI-P3, Rec.2020 and ProPhoto RGB are collected to compare. ISO-CCT lines and standard illuminants of A/B/C/D50/D55/D65/D75/E are included.
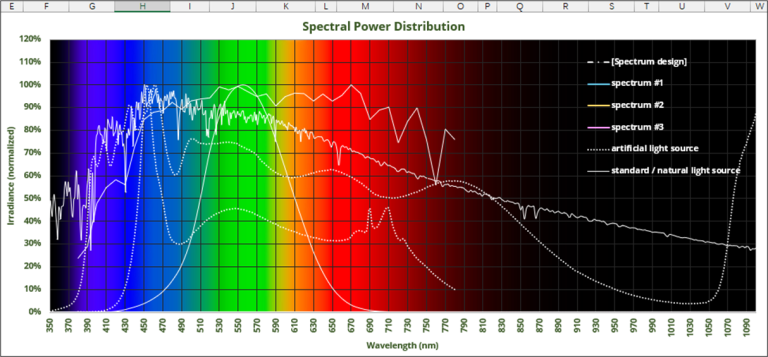
– Spectral power distribution data output.
The essential information from a designed spectrum is the spectral distribution which is the separated and normalized data by nanometers. The system provides this from 350nm to 1100nm with 1nm interval.
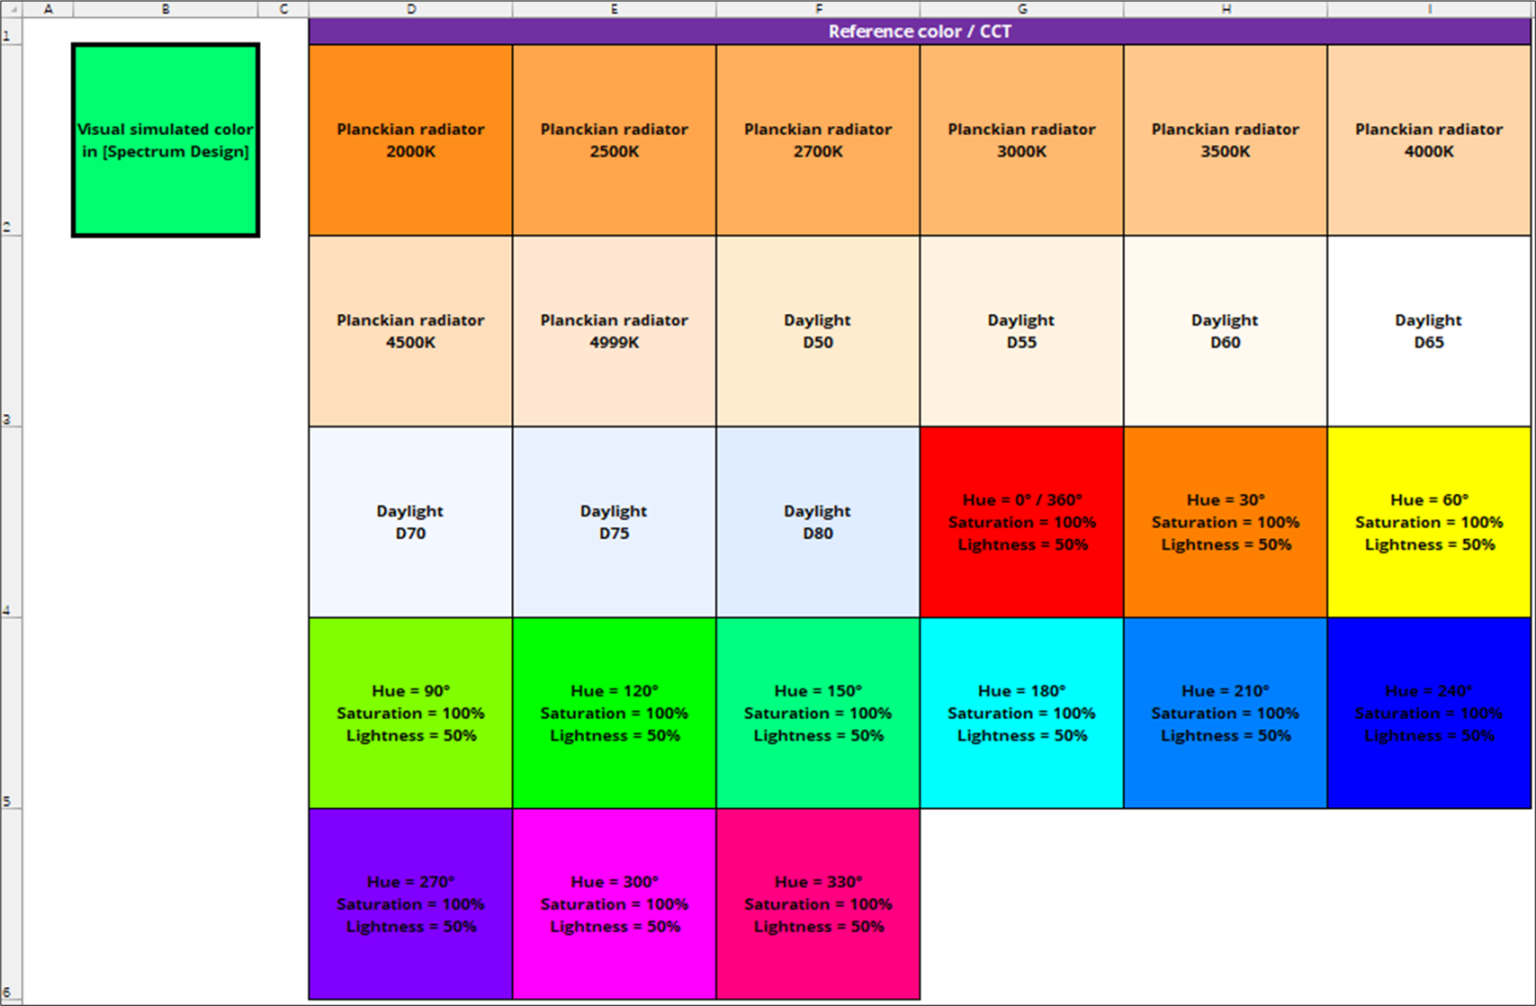
The visual color / CCT is the calculated RGB value from the chromaticity coordinate according to the designed spectrum, compared to other officially defined light sources or colors, the user can have an initial impression of how the designed light looks like.
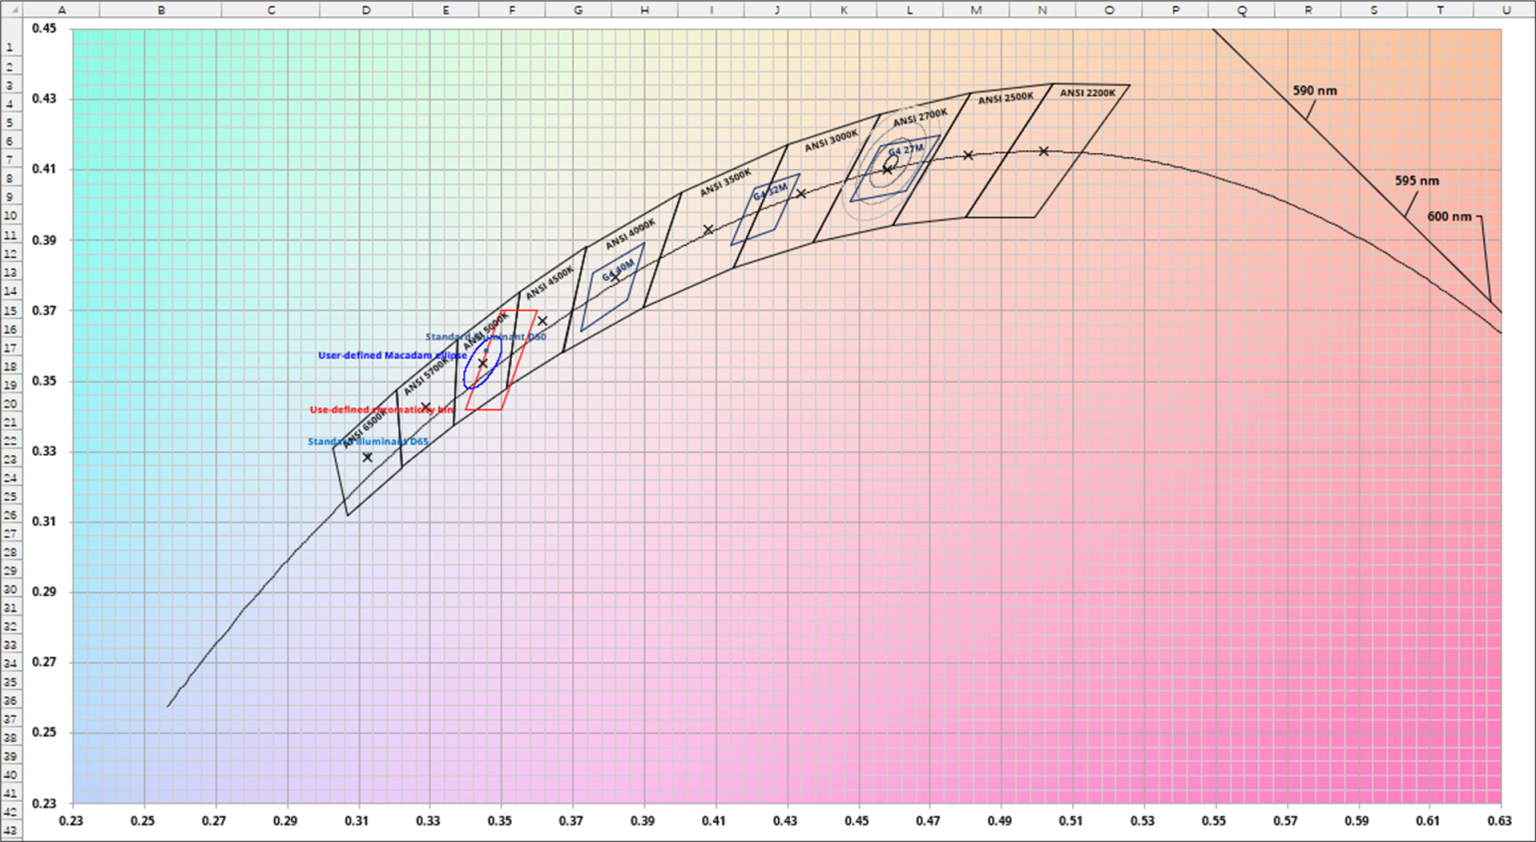
White light is most widely used in LED lighting industry. This part enlarges the CIE 1931 diagram’s white light range (along with the blackbody locus) for chromaticity analysis. Standard illuminant A/B/C/D50/D55/D65/D75/E, the ANSI C78.377, iso-CCT lines at different color temperatures, user-defined chromaticity bins (both for quadrangle and ellipse), Yujileds® chromaticity bins are all included. This part allows the user to input 5000 chromaticity coordinates to present the visual dots in the CIE diagram, and the relevant metrics of CIE 1960 u,v, CIE 1765 u’,v’, DUV can be calculated automatically.
Users can utilize this function to compare and analyze different spectra visually and quantitatively. It allows the user to input 3 self-defined spectra for comparison, other data, like Yujileds standard spectra, human body spectral response, photosynthesis, solar spectrum, CIE illuminants, Planckian radiation, natural light, conventional light sources and different LED sources are included.
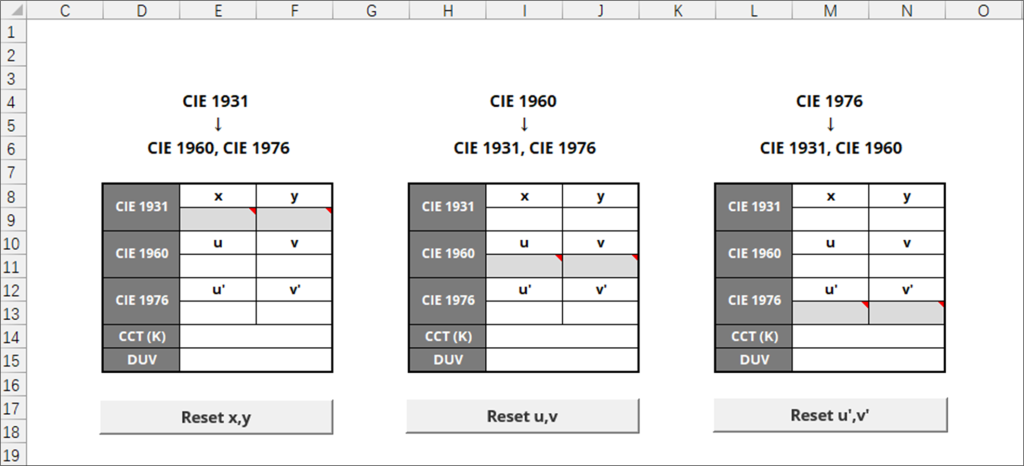
The system provides a function to convert the CIE 1931/1960/1976 coordinate mutually, and calculate the CCT and DUV accordingly. Users can get these basic color metrics directly with only the coordinate.
The SCS Pro is an ideal method as the interactive connection between idea and feasibility. In early stage of a product development, a key factor is evaluating the feasibility of different R&D ideas quickly and not costly. Then the SCS Pro can contribute greatly to the customers and it becomes an R&D “bridge” between customer and the team of Yujileds experts. With the SCS Pro we will be able to help customer evaluate the products feasibility within 3 days, and the conclusion is precise. Benefit from the time and production saving, the scientic and accurate evaluation, customers can win the successful business chance from their customers.
The SCS Pro is not only built with existed LED spectra but with the single spectral resources collected with most of the feasible LED phosphor/die spectra in the world, this feature makes it possible to create any spectrum result based on the LED principle, and the result can just be a theory that has never be made to an real LED before, this helps scientists with the theoretical research easier and efficiently that do not need to produce LEDs to get the experiment data.
Copyright © 2026 Beijing Yuji International Co., Ltd.