A Deep Tour on LED Phosphor Part II: Phosphor’s Performance
What are the characteristics of LED phosphors and their impacts on the performance of packaged LEDs?
The performance of LED phosphors mainly can be divided into the powder properties, particle size distribution, and stability (aging performance), etc. Usually, luminescent performance of LEDs mainly refers to the quantum efficiency of phosphors, spectrum, relative brightness, relative intensity, CIE1931 color coordinate, peak wavelength, FWHM (full width at half maximum) and so on, with some correlations among these parameters. In practical applications, different parameters tend to be chosen as the key performance indicators in different fields. In general, the parameters like (1) the quantum efficiency, (2) the CIE1931 color coordinate, (3) peak wavelength, and (4) FWHM are considered as the main optical performance parameters; the equivalent particle size, size distribution and discrete degree represent the powder particle properties; the light attenuation evaluates the stability in marketing and research analysis.
LED phosphor powder performance parameters
1. Quantum efficiency
The ratio of emission energy (photon number) from Luminescent materials to excitation energy (photon number)
Quantum efficiency ≈ Energy efficiency (η)
η=Eem/Ein
Eem:emission energy Ein:excitation energy
In the actual process, not all energy can be absorbed, and a certain proportion of energy is reflected or escaped. Therefore, the absorption rate is a parameter that is indispensable for the actual luminescence process. The above formula can be modified by using parameters like external quantum efficiency (eQE), internal quantum efficiency (iQE), and absorption rate (Abs).
l External quantum efficiency: the ratio of emitted photon number to all incoming photon number
l Internal quantum efficiency: the ratio of emitted photon number to the absorbed incident photon number
eQE=Abs*iQE
iQE=η=Eem/Ein
It is found that iQE is determined by the crystal structure of the LED phosphor itself. The better is the crystallinity, the higher is the iQE. The absorption rate is not only related to the crystal structure of the phosphor itself but is also extremely related to the particle size and particle size distribution of the powder. In the development and application of LED phosphors, the luminescent performance of phosphors is often judged by IQE. The corresponding ability of phosphors to excite energy is evaluated by absorption rate. EQE (the product of IQE and Abs) reflects the energy efficiency of the LED phosphor. It should be noted that the difference of QE between LED phosphors is large. There are also dramatic deviations if the LED phosphors are produced by different processes and different manufacturers even under the conditions of the same system, the same ratio, the same synthesis temperature and time. Taking MPR series nitride (1113) red phosphor as an example, which is produced by Beijing Nakamura Yuji Technology Co., Ltd., a subsidiary of Yuji Group, the IQE, absorption rate and other parameters of the series can reach double (both over 90%) as a result of the continuous improvement of process. The EQE determined by the two parameters is 2% higher than domestic and international competing products.
2. Spectra
Spectra indicates the excitation wavelength and emission wavelength of the LED phosphors.
(1) Excitation Spectrum (Ex)
l reflects the degree of the response to the external excitation light of the material.
l characterizes the effective wavelengths for excitation.
(2) Emission spectrum (Em)
l indicates the change of the radiation energy of the material under the excitation of specific wavelength.
l reflects the shape, location and energy intensity of the emission.
(3) Stokes law: the emission wavelength is longer than the excitation spectrum wavelength.
Stokes law, also known as Stokes shift, analyzes the mechanism of photoluminescence from the perspective of the spectrum, and side proofs the concept of quantum efficiency. During the illuminating process, the excitation energy is not completely absorbed by the LED phosphor, and some of the energy is reflected or transmitted. While most of the absorbed energy will be released in the form of light, the rest of the energy may be converted into heat, mechanical energy or other forms of electromagnetic waves. For the luminescence process, the energy loss causes the emitted energy to be less than the absorbed energy, and thus the wavelength of emitted light is shorter than that of the excitation light. This is so-called the Stokes shift.
3. Peak Wavelength(λ/nm)
WLP (Peak Wavelength): the wavelength corresponds to the maximum of the luminous intensity or the radiant power. It is a pure physical quantity and can be expressed in λp. Generally, the peak wavelength refers to either the excitation peak wavelength or the emission peak wavelength, which are represented by λex and λem, respectively. The excitation peak wavelength is the most responsive wavelength of the LED phosphor to the excitation energy. The emission peak wavelength is the wavelength of the light with the highest intensity emitted by the LED phosphor. In the actual applications of LED phosphors, LED devices are the foundation of luminescence. For different types of devices, the excitation light and excitation wavelength are determined. Therefore, peak wavelength often refers to the emission peak wavelength; and the wavelength of the excitation peak is hidden in the performance of the LED device.
4. Full Width at Half Maximum(FWHM)
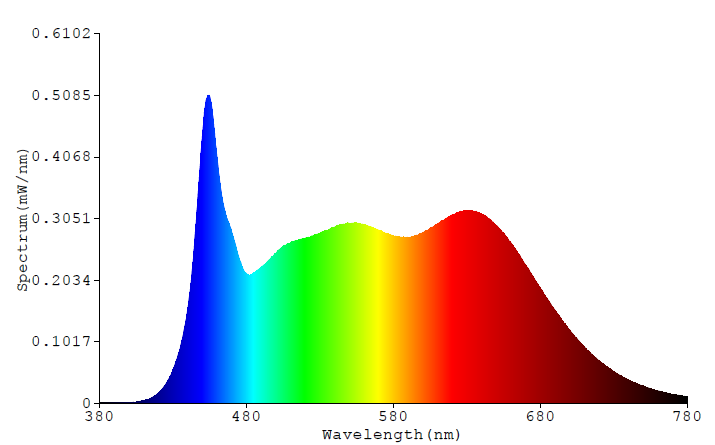
The FWHM is the linewidth at the half maximum height of the band, which objectively reflects the color purity and light area of the LED phosphor. Generally speaking, the narrower is the FWHM of the emission peak, the purer the color of the light it represents. And the wider is the FWHM of the emission peak, the broader the range of light it represents. In different areas, the requirements of FWHM are slightly different. For example, in the field of white LED illumination, the FWHM of the LED phosphor requires a certain width. The spectrum emitted by the LED device formed with phosphors and standard blue light can cover the entire visible region to achieve the “solar spectrum” effect. In the field of LED backlit display, the FWHM is the smaller the better, which leads to the purer emitted light color and is useful for color matching and color gamut distribution.
On the other hand, the FWHM also indicates the crystallinity of the LED phosphor. The better is the crystallinity of the phosphor, the less the lattice defects, and the narrower is the corresponding FWHM. Within the same system, the powder properties are better if the FWHM of the LED phosphor is narrower. And different systems have their own characteristic FWHM. For example, the FWHM of YAG yellow powder is 100-120 nm; the FWHM of nitride red phosphor (SCASN) is 70-90 nm; the FWHM of nitrogen oxide green phosphor (β-Sialon) is 40-60 nm; the FWHM of silicon fluoride red phosphor (KSF) is around 30 nm. Beijing Nakamura Yuji Technology Co., Ltd. (BNY) is made up of a strong team of domestic and foreign experts, relying on independent research and development to continuously improve the production processes and the quality of products. Under the same ratio and the same firing condition, the FWHM of the MPR series nitride red phosphor produced by BNY is 2% lower than that of the competing product due to the optimization of the process route, achieving the highest performance over the world.
Obviously, requirements are not the same in different fields, but BNY can provide customers with a full range of personalized customized products based on their strong research, development and production capacity.
5. Chromaticity coordinates (Cx,Cy)
.png)
The CIE 1931 chromaticity diagram is a CIE chromaticity diagram represented by nominal values, with x representing the red component and y representing the green component. Point E represents white light, whose coordinates are (0.33, 0.33). The colors surrounding the edge of the color space are the spectral colors, which are the most saturated colors. The numbers on the boundary represent the wavelengths of the spectral color, and the outline contains all perceived tones. All monochromatic light is located on the outline tongue curve, which is a monochromatic locus. And the actual colors in nature are located in the interior of the closed curve. The physical three primary colors selected in RGB system are on the tongue curve of the chromaticity diagram. In other words, each type of light could find a corresponding coordinate point representation in the CIE chromaticity diagram. If the connection of two coordinate points passes through the intermediate white light region, white light can be formed by the combination of the two phosphors. In practical LED phosphor applications, blue or violet light from semiconductor chips has a fixed color coordinate point, forming a triangle with the other two color coordinate points. If the geometric center of the triangle is in the white light region, it will achieve white LED illumination. In the development of white LED lighting, the earliest white light is formed by the combination of standard blue light and yellow phosphor for high CCT white light. However, despite of the advantages of LED, a low CRI (Ra) is presented at the same time. To promote CRI of LED devices, the process route gradually developed to standard blue light + green powder + nitride red powder (1113). The performance of LED devices based on the three-color solution is also constantly improving.
6. Particle Size
(1) Particle diameter and the equivalent diameter
Flaky, rod, Ellipsoid particles are approximated to sphere.
(2) The meaning of D10, D50, D90
D-values is a one of the methods for monitoring particle size distribution.
If we line up all the particles of the powder by particle diameter and cumulate the particles in a rising order. D10, D50 & D90 are the interception diameters for 10%, 50% and 90% of the cumulative mass.
In other words, D10 measures the fine particle diameter and D90 measures the coarse particle diameter of the powder. D50 is also called the median diameter.
(3) Distribution coefficient / Discrete degree
K = (D90 – D10) / D50
K indicates the uniformity of particle sizes.
QD = (D75 – D 25) / (D75 + D25)
Within the same K value, QD provides another approach to distinguish the uniformity of particle sizes.