LED lighting and color science [1-Science behind phenomenon]

Trick 1: Have you ever experienced that when you choose merchandise with your preferable color, sometimes the color changes when you take it out of the shop and view it under the sun, and sometimes the color also changes in your home or office.
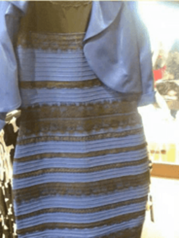
Trick 2: Do you still remember this picture (Figure 1.2) which was the hottest topic and swept across the globe in 2015?
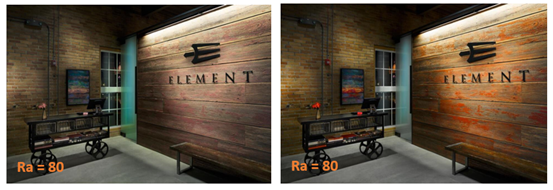
Trick 3: As we all know the most popular metric for evaluating the color rendering performance is CRI (Color Rendering Index), therefore the color should be vivid under a high CRI light source, while sometimes things are not like what we think (Figure 1.3).
What caused the color tricks above?
To reveal Trick 1, firstly we should understand metamerism.
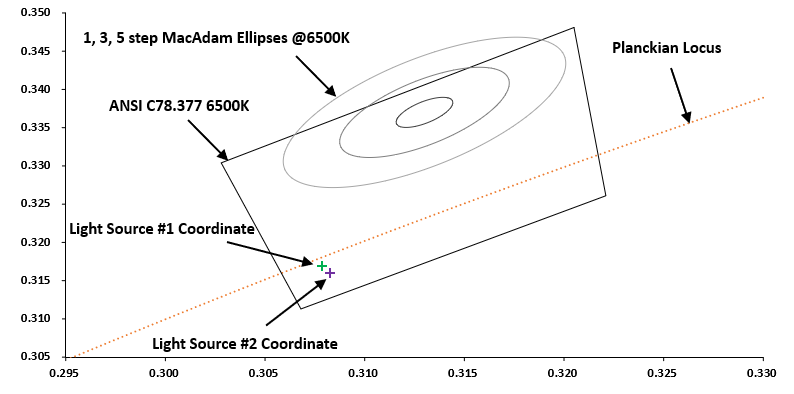
Metamerism means that the contrastive colors are with similar tristimulus values but different spectral power distributions. For easier understanding, we processed an experiment on 2 different light sources (Figure 2.1).
Apparently the Light #1 and #2 coordinates are in 1-step MacAdam Ellipse, thus we can consider they are the same color – similar spectral tristimulus values as mentioned above. The CIE (Commission Internationale de l´Eclairage) color space is based on the tristimulus value calculations, here we do not talk more about the formulas here since it is not our main topic, but it is easy to find and learn.
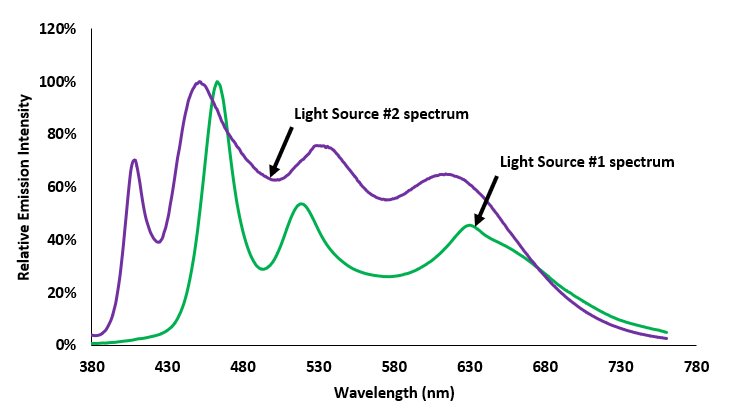
Since the color is the same, maybe the luminous effect should be the same as well? However, the spectral power distributions are quite different (Figure 2.2).
The Light Source #1 is an RGBW LED, this 6500K spectrum is tuned by adjusting the monochromatic chip R/G/B based on the W (3200K), and the final CRI – Ra is 78; the Light Source #2 is YUJILEDS® VTC series 6500K, CRI – Ra 95. We can find the Light Source 2 has a rich, wide and uniform spectrum comparing to Light Source #1, this leads to the similar result as Trick 1. This comparison is processed under both LED light sources which at least have similar principle of luminosity. Imaging if we compare the result under the sun, incandescent, fluorescent…then how much difference there will be?
Metamerism is a key concept for evaluating colors under different light sources, renowned color management companies or organizations like Konica Minolta, X-Rite, Datacolor, International Color Consortium, HunterLab, Color Basics.com…have explanations on it. CIE defines the quantitative reference for evaluating the metamerism degree – MIvis (Metamerism Index in the visible range) and MIuv (Metamerism Index in the UV range), and for printing industry, there is the standard of ISO3664:2009 that requires the viewing light source must be MIvis < 1.0 and MIuv < 1.5.
Evaluating color is complicated, people sense colors at least depending on these factors:
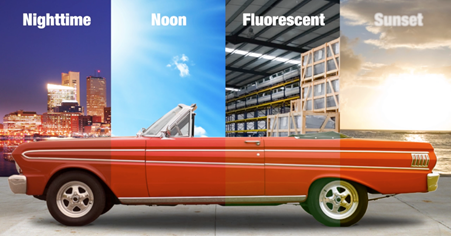
Now we know the light source is a key element for judging color. Objects might seem completely different under different light sources (Figure 2.3), so the most important is choosing an excellent viewing light.
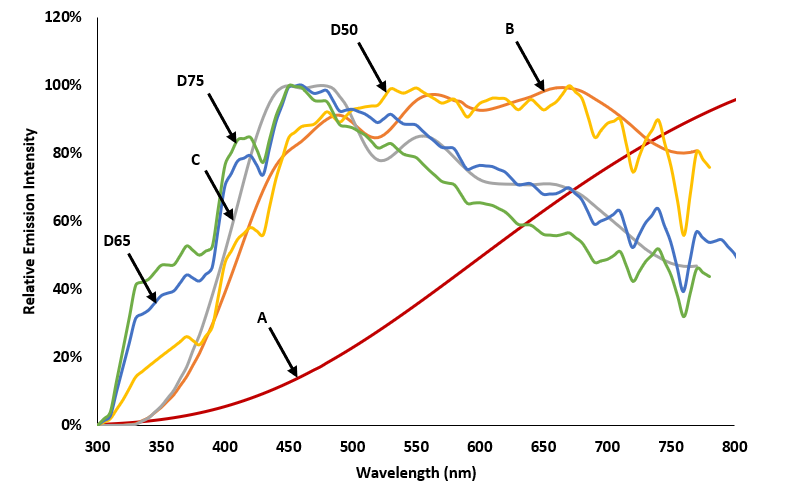
CIE defines Standard Illuminants (Figure 2.4) which are theoretical sources of visible light for comparing images or colors, ideally the SPD (Spectra Power Distribution) of viewing light source should approximate the Standard Illuminant to reduce the metamerism as far as possible.
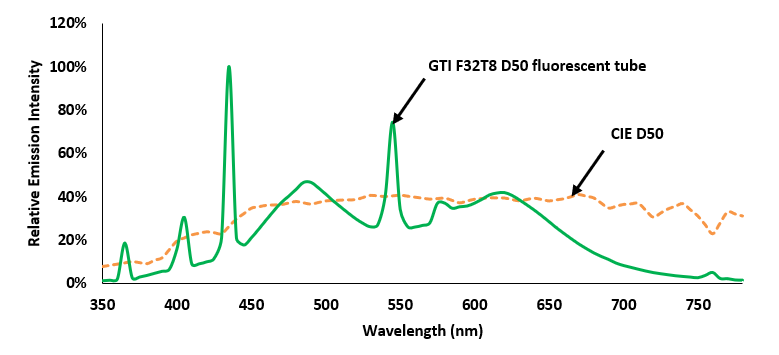
However, realistically it is impossible to make an artificial light source exactly same as the SPD of a Standard Illuminant, currently most companies are simulating it with fluorescent tube lamp (Figure 2.5) because of its full spectrum feature.
Based on a general statistical result, about 8% of men and 0.5% of women in the world have a color vision deficiency (COLOR BLIND AWARENESS), so averagely, women have better color perception than man.
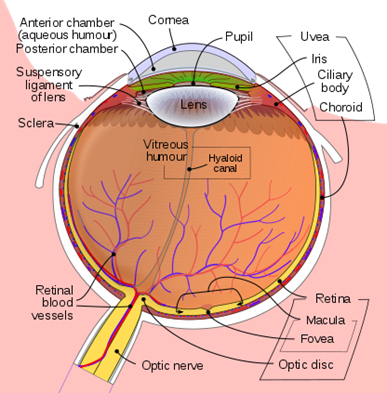
Besides sex, people over 60 years of age physical changes can occur which might affect a person’s capacity to see colors. A layer of macular pigment (Figure 2.6) covers the central yellow spot area of human eye’s retina, when observing an object under larger field of view than 4°, there is a reddish spot in the central of sight, this is called Maxwell’s Spot. With the increase of age, the macular pigment gets more and more yellow, this means older people might get different color sensitivity, especially on blue.
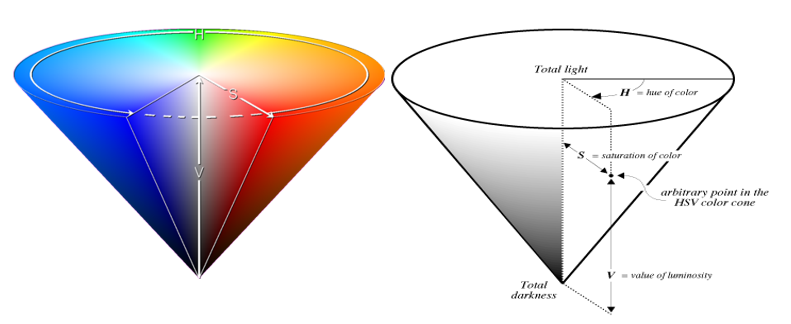
Color is at least a three-dimensional system (Figure 2.7), both HSL (Hue / Saturation / Lightness) and HSV (Hue / Saturation / Value) define so, it is easy to understand that the hue and saturation affect the color visual effect, but why brightness?
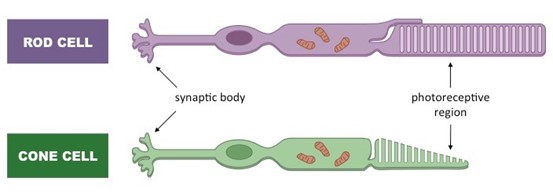
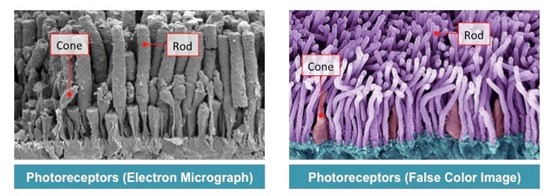
There are 2 kinds of photoreceptor cells distributed in human eyes – Rod cell and Cone cell (Figure 2.8). Generally, rod cell is for sensing brightness and cone cell is for sensing color, but with the changing of the brightness of the environment, the active cell changes. When under bright environment (10 – 108cd/m2), the cone cell plays a leading role, this is called cone cell vision or photopia vision; when the brightness gets down to 10-6 – 10-3.5cd/m2, the rod cell works, and this is called rod cell vision or scotopic vision, this is also the reason that people can hardly distinguish colors when the ambient light is weak.
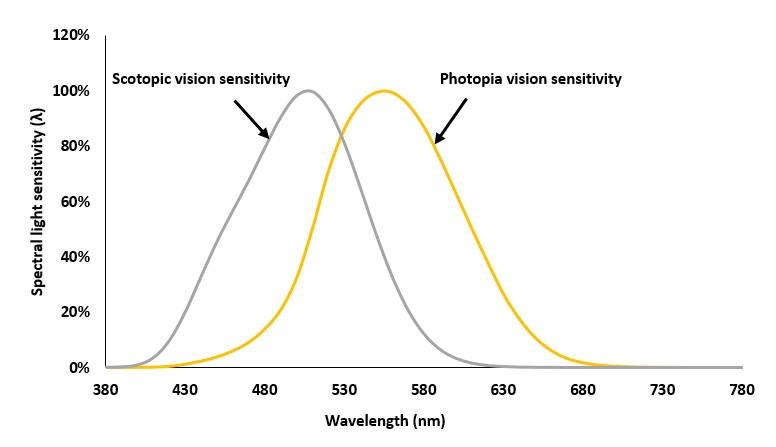
Human eye’s sensitivity is different under photopia and scotopic visions (Figure 2.9), with photopia vision, the most sensitive is around 555nm, with scotopic vision, people are more sensitive at around 498nm.
However in 2002, the third photoreceptor cell was found and it does not sense the visual light but the circadian rhythm mostly. It brings the topic of the human-centric lighting but we do not talk about it more here.
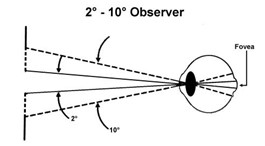
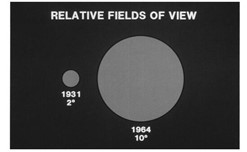
CIE 1931, which is based on 2° observer, is widely used in LED manufacture, display, print and image industries. It is called 2° observer because the status of judging color is through a hole that allows a 2° field of view. In 1931, it was believed that all the color-sensing cones of the eye were located within a 2° arc of the fovea, thus the 2° field of view was chosen and used in establishing the standard observer. By the 1960s, it was realized that the cones were present in a larger area of the eye than previously believed, and so in 1964, the 10° Standard Observer was developed (Figure 2.10), currently it is believed to best present the average spectral response of human observers.
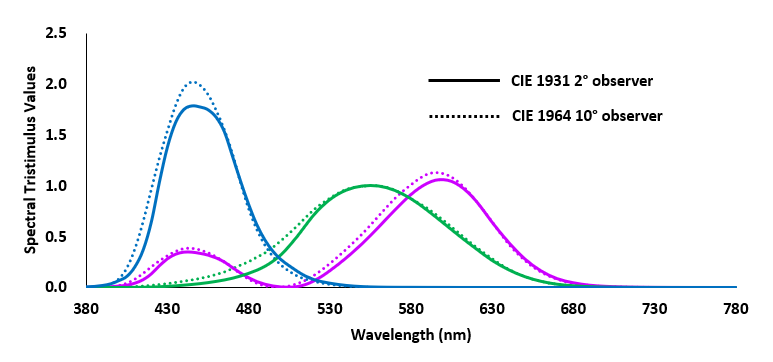
There is another essential difference between 2° and 10° field of view – the different spectral tristimulus values (Figure 2.11).
Although it seems that the difference is unapparent, we should notice the 10° observer spectral tristimulus values are relatively higher, which means the human eyes are more sensitive and could distinguish more wavelengths than 2° observer. Experiment results show that the wavelength discriminability under 10° is triple than 2°. In 2° field of view, human can distinguish 150 colors, while in 10° the number is 400-500. As for the explanation from biology, the Maxwell’s Spot, which we mentioned above, shows up when the field of view is getting larger than 4°, the spot results from the macular pigment which affects the sensitivity of blue mostly, and because the external area of the fovea is more sensitive on shorter wavelength, we can find the most obvious difference from the between 2° and 10° spectral tristimulus values is 400-500nm.
In realistic life, people are under 10° instead of 2° field of view environment mostly, but most of the LED manufacturers are still using 2° system like CIE1931. Osram is the first one proposing a TEN° binning method which is pioneering in this industry, however, as another matter of fact, there are few complaints regarding color tolerance based on the 2° and 10° difference, even for some critical applications like color science. Furthermore, the old CIE version is so widely recognized as standard, not only for general lighting, but for display, image detection and photographing applications, it is difficult to shake all these solidified industries in a short time simultaneously, but in any case, such concept must be a tendency, it is believable that the new standard will be popularized gradually in the future.
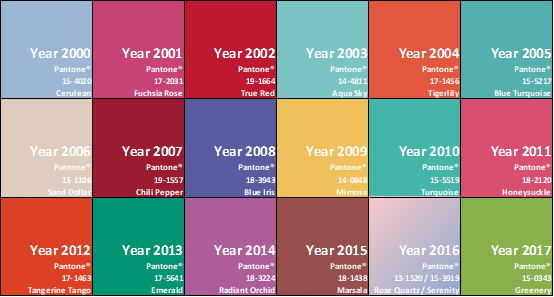
All indexes of color or light, eventually, are for human eyes, therefore the subjective factor will be involved inevitably, and the popular tendency might change, for instance, Pantone® publishes the “Color of the Year” (Figure 2.12) to summarize and forecast the yearly most popular color, this shows that the people’s color habit might change along with the development of technology, culture or even civilization.
In Trick 2, the reason of different color perception is more about the visual illusion of color constancy.
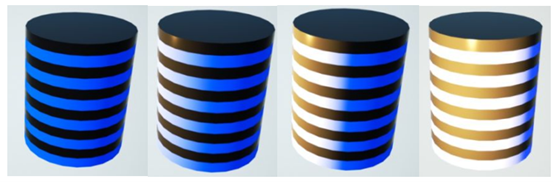
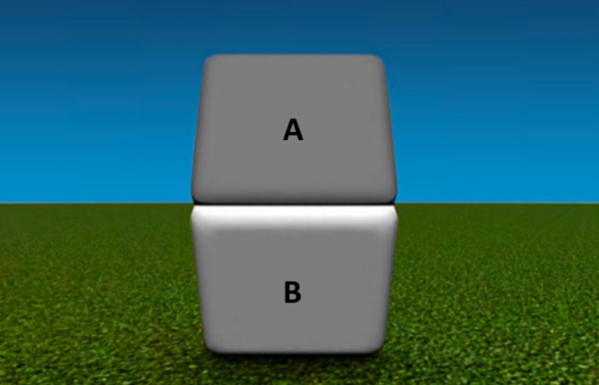
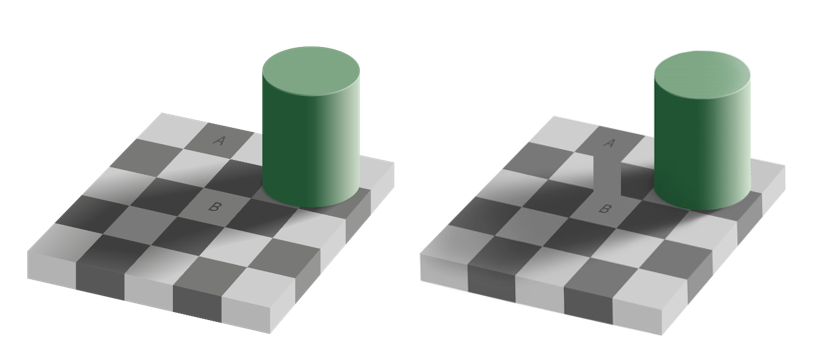
Lights enter the eye through the lens, and different wavelengths corresponding to different colors, as the tristimulus values mentioned above. The light hits the retina in the back of the eye where pigments fire up neural connections to the visual cortex, the part of the brain that processes those signals into an image. Critically, though, that first burst of light is made of whatever wavelengths are illuminating the world, reflecting off whatever you are looking at (from www.wired.com). The most important concept is that color perception is from your brain, not eyes, here is an interesting example to simulate the blue or golden perception (Figure 2.13), now we can see that people could perceive blue or golden under different lighting environments. Similar illusions occur in figure 2.14 and figure 2.15.
From the factors all above, we can conclude that the evaluation of color should be comprehensive, it is never meaningful to judge a color only by a so-called high CRI light source, on the other hand, it is also not meaningful to judge a light source under inconclusive environments. Then how do we evaluate the light color? In the next article, we will talk about the essence of the light – spectrum.
Copyright © 2026 Beijing Yuji International Co., Ltd.